THE SHORT ANSWER
Lead generation ROI is defined as the net revenue produced by your leads divided by the total cost of acquiring them. For B2B marketers and analysts, the ability to measure lead generation ROI accurately separates campaigns that grow pipeline from ones that quietly drain budget.
Lead generation ROI is defined as the net revenue produced by your leads divided by the total cost of acquiring them. For B2B marketers and analysts, the ability to measure lead generation ROI accurately separates campaigns that grow pipeline from ones that quietly drain budget. The standard industry term is marketing ROI, but in lead generation contexts, practitioners track it through specific metrics like Cost Per Lead (CPL), Cost Per Qualified Lead (CPQL), and Lead Velocity Rate (LVR). Getting these numbers right requires clean attribution data, a structured review cadence, and a clear formula applied consistently across channels.
What metrics do you need to measure lead generation ROI?
Lead generation ROI measures how much revenue comes from specific lead generation efforts compared to what you spent. That definition sounds simple. The execution is not.
The starting point is net revenue, which equals gross revenue minus returns, discounts, and sales allowances. Using gross revenue inflates your ROI figure and leads to poor budget decisions. Net revenue gives you the honest number.

From there, four metrics form the core of any reliable ROI analysis:
Metric | Definition | Role in ROI calculation |
|---|---|---|
Cost Per Lead (CPL) | Total spend divided by total leads generated | Baseline efficiency measure by channel |
Cost Per Qualified Lead (CPQL) | Total spend divided by qualified leads only | Accounts for lead quality and conversion potential |
Lead-to-Opportunity Conversion Rate | Percentage of leads that become sales opportunities | Connects lead volume to pipeline value |
Lead Velocity Rate (LVR) | Month-over-month growth in qualified leads | Leading indicator of future revenue |
CPQL is more useful than CPL because it accounts for lead quality. An expensive lead that converts into a high-value customer produces better ROI than a cheap lead that never closes. Tracking CPL alone gives you a cost number without a revenue context.
Segmenting CPL and CAC by channel reveals which sources actually drive efficient growth. An overall CPL figure tells you very little. A channel-level breakdown tells you where to shift budget.
Pro Tip: Build your metrics dashboard so CPL and CPQL appear side by side for every channel. The gap between them reveals how well each source delivers qualified traffic, not just volume.
How do attribution models connect lead efforts to revenue?
Attribution is the process of assigning revenue credit to the marketing touchpoints that influenced a conversion. Without attribution, you cannot calculate lead generation ROI by channel or campaign. You are left with a blended number that hides both your best and worst performers.
Single-touch models
First-touch attribution gives 100% of the credit to the first interaction a lead had with your brand. Last-touch attribution gives 100% to the final interaction before conversion. Both are easy to implement and easy to misread.
Pros of single-touch models:
Simple to set up in most CRM systems
Clear, fast reporting with no complex weighting required
Cons of single-touch models:
Ignores every touchpoint between first and last interaction
Overvalues either awareness channels or closing channels depending on which model you use
Misleads budget decisions in long B2B sales cycles
Multi-touch models
Multi-touch attribution assigns credit to every touchpoint using methods like linear distribution (equal credit to all touches) or time-decay distribution (more credit to recent touches). These models reflect the reality of B2B buying behavior more accurately.
Pros of multi-touch models:
Reflects the full buyer journey across multiple channels
Prevents over-investment in a single channel based on incomplete data
Supports more accurate ROI analysis for marketing leads
Cons of multi-touch models:
Requires consistent tracking across all touchpoints
More complex to configure and maintain
Time-decay models can undervalue early-stage awareness efforts
B2B sales cycles lasting 6–12 months complicate attribution significantly. A lead might touch your brand through paid search, a webinar, a LinkedIn ad, and a sales email before converting. Single-touch models miss most of that story.
Pro Tip: Integrate your marketing automation platform with your CRM before choosing an attribution model. Clean, connected data makes any model more accurate. Without it, even a sophisticated time-decay model produces unreliable output.
How do you calculate and interpret lead generation ROI step by step?
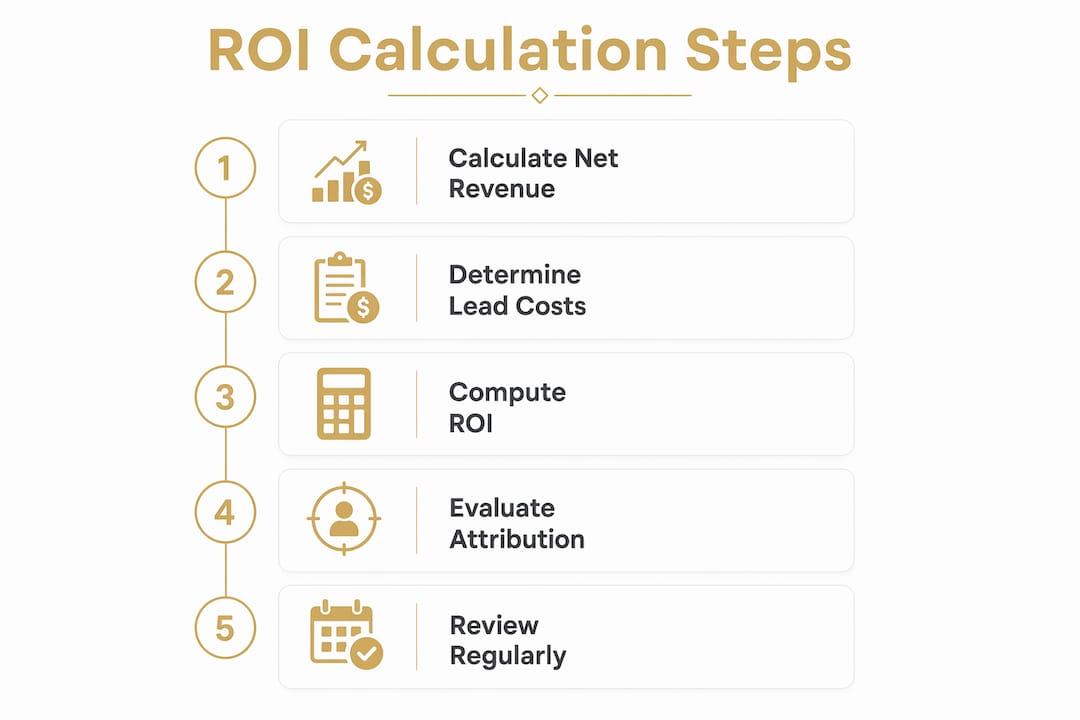
The core formula for calculating lead generation ROI is straightforward: (Net Revenue minus Cost) divided by Cost, expressed as a percentage. A result of 300% means you earned $3 for every $1 spent. The challenge is not the math. It is gathering the right inputs.
The calculation process
Define your cost inputs. Include ad spend, agency fees, content production, software subscriptions, and any staff time directly tied to lead generation campaigns.
Calculate net revenue per channel. Pull closed-won deal values from your CRM, subtract discounts and returns, and attribute each deal to its originating channel using your attribution model.
Apply the ROI formula by channel. Run the calculation separately for paid search, organic, email, events, and any other active source. A blended number hides performance differences.
Identify high and low performers. Channels with strong CPQL and high conversion rates deserve more budget. Channels with high CPL and low close rates need either optimization or reallocation.
Review Lead Velocity Rate as a forward indicator. LVR measures month-over-month growth in qualified leads. Sustained LVR growth predicts rising bookings roughly six months later, giving you time to act before revenue trends shift.
Segmenting your analysis by campaign, not just channel, adds another layer of precision. Two campaigns running on the same channel can produce very different CPQL figures depending on targeting, offer, and landing page quality.
Pro Tip: Watch LVR every month even when overall revenue looks healthy. A declining LVR signals a future pipeline gap before it shows up in closed revenue. Catching it early gives you time to course-correct.
What are the most common pitfalls when assessing ROI for leads?
Most ROI measurement errors come from three sources: bad data, incomplete attribution, and the wrong metrics. Each one produces a distorted picture that leads to poor budget decisions.
Poor data quality is the biggest barrier to accurate ROI measurement. Duplicate records, missing contact fields, and untracked touchpoints all corrupt your attribution model. The output is only as reliable as the data feeding it.
The most common pitfalls B2B marketers run into:
Relying on total lead volume. Volume metrics like total leads are easy to report but rarely indicate commercial output. A campaign that generates 500 unqualified leads costs more than it earns.
Focusing only on CPL. Experienced practitioners prioritize CPQL and Cost Per Closed Deal as better revenue impact metrics. CPL without quality context is a cost number, not a performance number.
Ignoring multi-touch attribution. Using last-touch only in a multi-channel B2B environment systematically undervalues awareness and nurture channels.
Overreacting to short-term fluctuations. A single bad week in paid search does not indicate a broken channel. Short-term noise in KPIs leads to premature budget cuts.
No structured review cadence. ROI reporting should be layered by cadence: weekly reviews for tactical metrics like paid channel performance, monthly reviews for efficiency metrics like CPL and Customer Acquisition Cost (CAC), and quarterly reviews for strategic metrics like the LTV:CAC ratio.
The fix for most of these pitfalls is the same: agree on your metric definitions before you build your reports, and set a review schedule that matches the decision type. Tactical decisions need weekly data. Strategic budget shifts need quarterly context.
Key Takeaways
Accurate lead generation ROI requires clean data, proper attribution, and a structured review cadence applied consistently across channels and campaigns.
Point | Details |
|---|---|
Use net revenue, not gross | Subtract returns and discounts before calculating ROI to avoid inflated results. |
Prioritize CPQL over CPL | Cost Per Qualified Lead reflects conversion potential and revenue impact more accurately than raw cost per lead. |
Apply multi-touch attribution | Assign credit across all touchpoints to avoid systematically undervaluing key channels in long B2B sales cycles. |
Track LVR as a leading indicator | Month-over-month growth in qualified leads predicts future revenue roughly six months in advance. |
Use a layered review cadence | Run weekly tactical reviews, monthly efficiency checks, and quarterly strategic evaluations to avoid reacting to short-term noise. |
Why most B2B teams measure ROI wrong
I have seen this pattern more times than I can count. A marketing team builds a dashboard, fills it with metrics, and then makes budget decisions based almost entirely on CPL. The channel with the lowest cost per lead gets more money. The channel with the highest CPL gets cut. Six months later, pipeline is down and nobody can explain why.
The problem is that CPL is a cost metric, not a revenue metric. It tells you what you paid. It does not tell you what you earned. The teams that actually improve lead conversion rates over time are the ones that shift their attention to CPQL and Cost Per Closed Deal. Those numbers connect spending to outcomes.
The other mistake I see constantly is treating attribution as a one-time setup task. Attribution accuracy degrades as your channel mix changes, as new campaigns launch, and as your CRM data accumulates gaps. You need to audit your attribution model at least quarterly. If your data is clean and your model is current, your ROI numbers are trustworthy. If either one slips, your decisions are based on fiction.
The teams that get this right share one habit: they treat their lead generation performance metrics as a living system, not a static report. They review, question, and adjust on a schedule. That discipline is what separates teams that grow pipeline from teams that just report on it.
— Mieke
How Flockleads supports accurate lead generation ROI
B2B marketers who want reliable ROI data need a lead source that delivers clean, validated contacts from the start. Dirty data at the top of the funnel corrupts every metric downstream.

Flockleads generates leads for B2B companies and sends them directly to your website, giving your team a consistent, trackable flow of contacts to measure against. That consistency makes channel-level attribution more accurate and CPL calculations more meaningful. When your lead data is clean and your volume is predictable, your ROI analysis reflects reality. Visit Flockleads to see how engineered lead flow can give your marketing team numbers it can actually trust.
Frequently asked questions
What is the formula for lead generation ROI?
Lead generation ROI equals net revenue minus lead generation cost, divided by lead generation cost, expressed as a percentage. Net revenue must exclude returns, discounts, and sales allowances for the result to be accurate.
Why is CPQL better than CPL for B2B marketing?
Cost Per Qualified Lead accounts for lead quality by measuring only leads with genuine conversion potential. A low CPL means nothing if those leads never close into revenue.
What is Lead Velocity Rate and why does it matter?
Lead Velocity Rate measures month-over-month growth in qualified leads. Sustained LVR growth predicts rising revenue roughly six months later, making it one of the most useful forward-looking indicators in B2B pipeline management.
How do multi-touch attribution models improve ROI accuracy?
Multi-touch attribution assigns revenue credit to every touchpoint in the buyer journey, not just the first or last. This prevents systematic undervaluation of awareness and nurture channels that contribute to conversion without closing the deal directly.
How often should B2B teams review lead generation ROI?
Teams should run weekly tactical reviews, monthly efficiency reviews covering CPL and CAC, and quarterly strategic reviews covering LTV:CAC ratios. This layered cadence prevents overreaction to short-term noise while keeping strategic decisions grounded in trend data.
NEED A CLEARER PLAN?
Let’s turn your next move into momentum.
Talk to us →