THE SHORT ANSWER
Your most profitable customers are the segments that deliver the highest contribution margin after fully accounting for acquisition and service costs, not the accounts with the biggest invoices. A customer paying you $80,000 a year can lose money once you subtract support tickets, onboarding hours, and ad spend to win them.
Your most profitable customers are the segments that deliver the highest contribution margin after fully accounting for acquisition and service costs, not the accounts with the biggest invoices. A customer paying you $80,000 a year can lose money once you subtract support tickets, onboarding hours, and ad spend to win them. Here’s the fix in three moves: measure contribution margin per customer, score and segment the results, then prioritize action around what the numbers actually show.
Run this in the next hour: export your last 90 days of invoices or subscription charges into a spreadsheet, next to whatever cost data you have (support tickets, ad spend by source, hours logged). You don’t need a full data warehouse to start.
Measure: calculate contribution margin per customer, not just revenue.
Score: rank and segment using RFM or an LTV:CAC ratio.
Act: reprice, protect, or drop segments based on where they land.
Pro Tip: Pull your top 20 accounts by revenue first. That group typically covers 60 to 80% of total revenue. It’s where the ugliest profitability surprises usually hide.
Point | Details |
|---|---|
Rank by margin, not revenue | Revenue leaderboards often hide your least profitable accounts near the top. |
Start with your top 20 | This group usually represents 60 to 80% of revenue and reveals the biggest surprises. |
Score, then act | Use RFM or LTV:CAC to segment customers into groups that need different treatment. |
Key Takeaways
Identifying your most profitable customers requires calculating contribution margin per account, scoring the results with RFM or LTV:CAC, and acting on the segments that framework reveals.
Point | Details |
|---|---|
Margin beats revenue | Rank customers by contribution margin, since high revenue often hides low or negative profitability. |
Start with the top 20 | Analyzing your top 20 accounts by revenue typically covers 60 to 80% of total revenue and surfaces surprises fast. |
Use a quadrant model | Sort customers into Core, Giants, Drain, and Long tail to decide who to protect, reprice, or automate. |
Sync scores to your CRM | Push profitability scores into your CRM so sales and support teams act on them daily. |
Get acquisition help from Flockleads | Flockleads routes qualified B2B leads matching your profitability profile directly into your CRM. |
What Metrics Actually Show You Who’s Profitable
Contribution margin is the number that matters most, and it’s calculated as (Gross Revenue − Variable Costs) ÷ Gross Revenue. Variable costs include everything tied to serving that specific customer: sales commissions, customer acquisition cost (CAC), customer success manager hours, cloud or API usage, and transaction fees. This is different from gross margin, which usually nets out only the cost of goods sold and ignores the labor and infrastructure a customer actually consumes.
Alongside contribution margin, track these four numbers for every segment:
Customer lifetime value (LTV): total expected profit over the relationship, not just total revenue.
CAC: fully loaded cost to acquire that customer, including ad spend and sales time.
LTV:CAC ratio: a widely used benchmark for whether acquisition spend is paying off.
Churn and retention rate: how long a segment sticks around, which determines whether LTV projections hold up.
Pro Tip: Attribution matters more than people think. If your CAC figure doesn’t trace back to the actual lead source that closed the deal, your LTV:CAC ratio is guesswork dressed up as math.
How Do You Turn Raw Data Into a Ranked Customer List?
This is the part most teams skip, then wonder why their “profitable customer” list is really just a revenue list with extra steps. Here’s the repeatable version.
Pick your value signals. Start narrow: revenue, tenure, support ticket volume, and product usage cover most businesses.
Gather the data. Pull billing records, support tickets, and product or CRM logs. Most teams find this scattered across Stripe, Zendesk, and a product database, which is exactly why the next unified fix matters.
Join the datasets on customer ID so each row represents one account with all its costs and revenue attached.
Calculate contribution margin per customer using the formula above.
Rank the list from highest to lowest margin, not highest to lowest revenue.
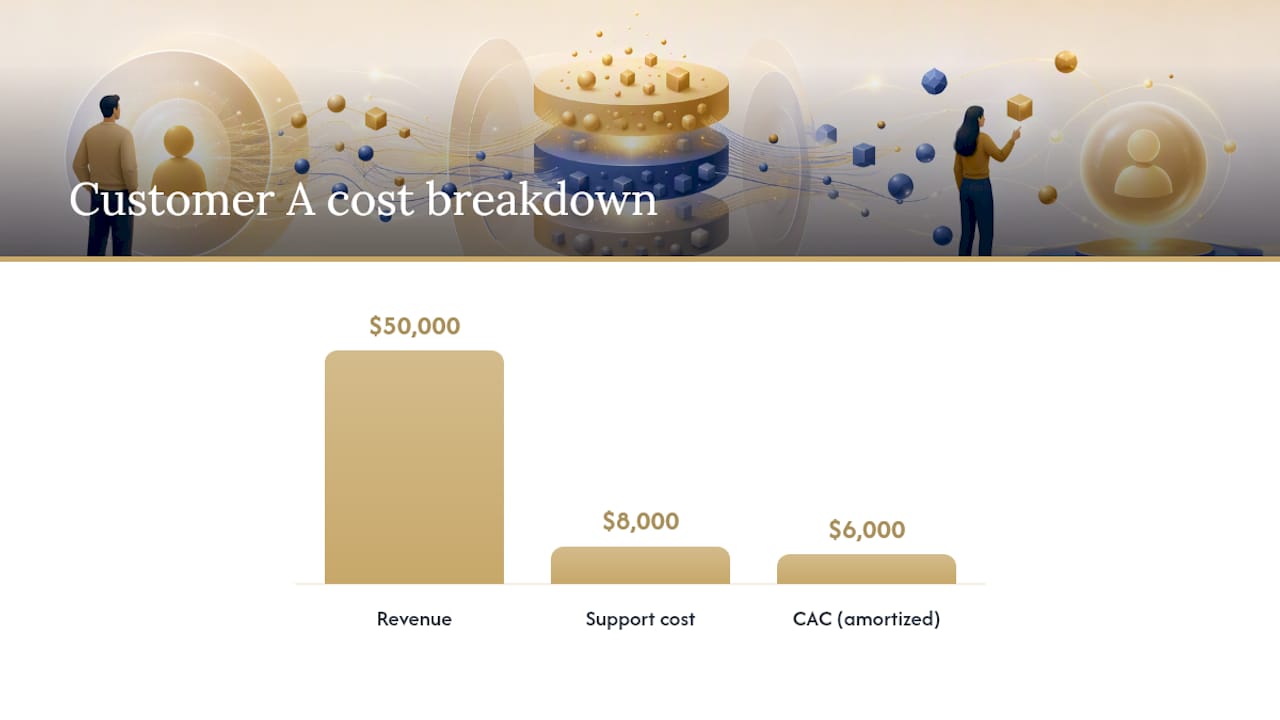
Here’s a simplified walkthrough. Say Customer A pays $50,000 a year, costs $8,000 in support and $6,000 in CAC amortized over the contract. Customer A is smaller and more valuable.
Data source | What it provides | Common gap |
|---|---|---|
Billing/invoicing system | Gross revenue per customer | Discounts or credits not always itemized |
CRM or sales records | Acquisition cost, deal source | CAC rarely allocated per closed deal |
Support platform | Ticket volume and resolution hours | Hours logged inconsistently across reps |
Product/usage logs | Feature adoption, active seats | Usage data often lives outside the CRM entirely |
Before trusting the output, run a quick validation pass: spot check five accounts by hand, confirm no customer is missing a cost line, and flag anything with a $0 CAC (it’s usually missing data, not a free customer).
Pro Tip: If your CAC numbers feel unreliable, compare cost per lead against cost per acquisition before you build your ranking. Fixing that upstream saves you from re-running the whole analysis later.
Which Scoring Model Should You Use to Segment Customers?
RFM (Recency, Frequency, Monetary) works well when you have lots of repeat, transactional customers, like ecommerce or subscription billing. LTV:CAC works better for B2B or long-sales-cycle businesses where the real question is whether an account will still be paying you in two years. Both approaches are common enough that customer scoring models built around them show up across most ecommerce and SaaS platforms.
Once you’ve scored customers, drop them into a quadrant model:
Core: high margin, high volume. Protect these relationships above all else.
Giants: high revenue, low margin. Candidates for repricing or service-level changes.
Drain: low revenue, low margin, high effort. Consider automating or exiting.
Long tail: low revenue but low cost to serve. Leave mostly on autopilot.
Segment | Revenue | Margin | Action |
|---|---|---|---|
Core | High | High | Protect, deepen the relationship |
Giants | High | Low | Reprice or restructure service |
Drain | Low | Low | Automate or exit |
Long tail | Low | High or neutral | Leave low-touch |
Pro Tip: Don’t overengineer the weights on day one. A rough score that gets used beats a perfect one stuck in a spreadsheet nobody opens.
What Tools Do You Need to Run This Analysis?
Small teams don’t need a data warehouse to start. A spreadsheet, exportable CSVs from your billing and support tools, and a couple of calculated fields in your CRM will get you a working profitability score within a week.
Data teams with more volume should build toward a warehouse plus dbt models, with scores pushed back into the CRM through reverse ETL. That’s typically a multi-week project, but it pays off once you’re segmenting thousands of accounts monthly.
Your starter CSV should capture: customer ID, monthly or annual revenue, contract start date, support ticket count, feature usage, and acquisition channel.
Spreadsheet + CSV exports for teams under a few hundred customers.
CRM calculated fields once you’re ready to automate scoring.
Warehouse + dbt + reverse ETL for teams scaling past manual tracking.
Pro Tip: Before building a CRM workflow around bought leads, check the minimum CRM setup needed to sync scores without breaking your existing pipeline stages.
What Should You Do Once You Know Who’s Profitable?
Knowing the ranking is useless without a plan attached to it.
Protect your Core segment first: set renewal outreach cadences and assign your best account managers using strategies from Stop Paying to Re-Acquire Customers You Already Won | JobOS Pro.
Reprice or restructure your Giants: renegotiate terms or shift them to a lower-touch service tier.
Automate or sunset your Drain segment: reduce support SLAs or route them to self-serve.
Build a wedge offer, like a scoped audit or short roadmap, to filter for high-fit prospects before a full engagement.
Set CRM flags that trigger escalation when a Core account’s usage drops.
Redirect new acquisition spend toward the channels that produced your Core segment, not just your highest-revenue one.
Pro Tip: Check whether Google Ads or bought leads get you more Core-segment customers before doubling your budget on whichever channel feels familiar.
What Mistakes Quietly Wreck a Profitability Analysis?
The most common error is averaging variable costs across all customers instead of attributing them individually, which flattens exactly the differences you’re trying to find. A close second: confusing revenue rank with profitability rank, which sends resources toward accounts that are actually draining margin.
Averaging support or CAC costs instead of tracking them per account.
Ignoring the effort spent on churned customers before they left.
Treating a scoring model as final instead of testing it against actual retention and expansion.
If your Core segment doesn’t retain or expand better than your Drain segment six months later, your weights need adjusting.*
Why Contribution Margin Deserves to Be Your First Metric
Most businesses optimize for revenue because it’s the easiest number to see. Contribution margin is harder to compute and far more honest about where money actually gets made, which is exactly why it reorders leaderboards so often. Once profitability scores are synced into a CRM through reverse ETL, lead routing and attribution stop being guesswork and start reflecting what a customer is genuinely worth.

Get Help Turning This Into a Lead Generation Plan
Running this analysis by hand tells you who your best customers are. Turning that into more of them is a different problem, and it’s the one Flockleads exists to solve. Instead of guessing which channels bring in Core-segment customers, Flockleads runs qualifying campaigns across Meta, LinkedIn, Google, and TikTok, then routes only the leads that match your profitability profile straight into your CRM.

If you’d rather test the acquisition side first, buying exclusive leads is a lower-commitment way to see whether a channel produces Core-quality accounts before you scale spend. And if your business model looks more like contractor work than SaaS, the lead generation approach for contractors covers how qualification filters change by industry. Request a free audit from Flockleads and get a snapshot of where your current lead sources rank against the profitability tiers you just built.
Sources
Frequently asked questions
What is the 10-5-3 rule in customer service?
The 10-5-3 rule suggests acknowledging a customer with eye contact from a distance, greeting them verbally as you approach, and using their name or a personal touch when you get close. It’s a retail service guideline, not a profitability metric, though it’s often confused with customer segmentation frameworks.
Can you give examples of ideal, high-value customers?
An ideal customer typically has high contribution margin, low support burden, strong product usage, and a renewal history longer than average. In practice, that’s often a mid-sized account that pays consistently, rarely files tickets, and expands usage over time rather than the single largest account on your books.
What are the most profitable types of businesses?
Profitability varies heavily by cost structure rather than industry alone; software, professional services, and subscription businesses tend to post strong margins because variable costs per customer are relatively low once the product is built. Physical goods and high-support businesses often carry higher cost-to-serve, which compresses margin even at similar revenue levels.
What are the different types of customers businesses typically segment?
Common segmentation frameworks include categories like loyal customers, high-spend but high-cost customers, one-time buyers, discount-driven customers, and advocates who refer new business. The quadrant model in this guide (Core, Giants, Drain, Long tail) organizes these types specifically around profitability rather than behavior alone.
How does Flockleads help identify or acquire profitable customer segments?
Flockleads runs qualifying ad campaigns and routes leads directly into your CRM, which lets you tag incoming leads against the same profitability signals used in your scoring model. That makes it easier to direct new acquisition spend toward channels producing Core-segment customers instead of just high lead volume.
NEED A CLEARER PLAN?
Let’s turn your next move into momentum.
Talk to us →