THE SHORT ANSWER
Churn rate in B2B measures how many customers, or how much revenue, you lose over a set period, and it comes in two flavors that tell different stories. Customer churn (also called logo churn) tracks the percentage of accounts that leave. Revenue churn tracks the percentage of recurring revenue you lose, including downgrades, not just cancellations.
Churn rate in B2B measures how many customers, or how much revenue, you lose over a set period, and it comes in two flavors that tell different stories. Customer churn (also called logo churn) tracks the percentage of accounts that leave. Revenue churn tracks the percentage of recurring revenue you lose, including downgrades, not just cancellations. For established B2B SaaS companies, median annual logo churn sits around 3.5%, and anything under 5% annually is generally considered solid.
The formulas are simple on paper:
Customer churn rate = (customers lost ÷ customers at start of period) × 100
Revenue churn rate = (MRR lost from cancellations and downgrades ÷ MRR at start of period) × 100
Here’s where most teams trip up: churn compounds. A monthly rate that looks harmless, say 3%, does not multiply into 36% annually. It compounds to roughly 30.6% because you’re losing a percentage of a shrinking base every month, not a flat slice of the original one. Get that math wrong and your board deck understates the leak by five or six points.
Key Takeaways
B2B churn rate measures lost customers or lost revenue as a percentage, and it must be calculated with the compound formula, not simple multiplication, to avoid understating annual loss.
Point | Details |
|---|---|
Track two churn types | Report customer churn and revenue churn separately since they measure different risks. |
Use the compound formula | Convert monthly to annual churn with 1 minus (1 minus monthly rate) to the 12th power, not simple multiplication. |
Benchmark by segment | Median B2B SaaS annual logo churn is about 3.5%; compare within your own ARPA tier, not against a blended average. |
Fix involuntary churn first | Failed payments can drive 20% to 40% of logo churn and recover quickly with better dunning automation. |
Improve lead fit upstream | Flockleads helps B2B companies qualify leads before they enter the funnel, reducing the poor-fit signups that drive early churn. |
How Do You Calculate B2B Churn Rate?
Start with the base formula, then decide what you’re actually measuring. Customer churn counts logos: divide accounts lost by accounts you started the period with, multiply by 100. Revenue churn does the same math with dollars, using starting MRR or ARR as the denominator instead of headcount. The two numbers rarely match, and the gap between them is itself diagnostic. If revenue churn runs higher than customer churn, you’re losing your biggest accounts. If it runs lower, small customers are walking out the door while your whale accounts hold steady.
The trickiest part is converting between time windows. You can’t just multiply a monthly rate by 12. The correct method uses the compound formula:
Annual churn = 1 − (1 − monthly churn rate)^12
A worked example: if you lose 3% of customers every month, your monthly retention rate is 97%. Raise 0.97 to the 12th power and you get about 0.694, meaning you retain 69.4% of customers over the year. Subtract from 1 and annual churn lands near 30.6%, not the 36% simple multiplication would suggest.
To calculate your own numbers:
Pick a consistent period (monthly is standard for SaaS with monthly billing).
Count customers or MRR at the start and end of that period, excluding new business added during it.
Divide the loss by the starting figure and multiply by 100.
If you need an annualized view from monthly data, apply the compound formula rather than multiplying by 12.
Also decide upfront whether you’re running cohort-based churn (tracking one signup group over time) or period-based churn (a snapshot across your whole base each month). Cohort analysis reveals whether churn concentrates in early months or spreads evenly, which period churn hides.
Voluntary vs Involuntary Churn: What’s the Difference?
Not all churn comes from the same place, and lumping it together wastes your retention budget on the wrong fix. Voluntary churn happens when a customer actively decides to leave: a champion quits and nobody re-sells the value internally, the company gets acquired or shuts down, or a competitor wins the renewal. Involuntary churn happens passively, usually from a failed credit card charge, an expired payment method, or a lapsed procurement approval that nobody caught in time.
The two require completely different responses:
Champion departure shows up as a sudden usage drop and silence on email threads, and it calls for multi-threading the account before renewal, not after.
Company closure or acquisition is largely unpreventable, but it’s worth flagging in churn reports so it doesn’t get miscoded as a product failure.
Competitor losses usually trail a slow decline in NPS scores and feature requests going unanswered.
Failed payments are the most fixable category. Involuntary churn can account for 20% to 40% of total logo churn at companies between $1 million and $10 million in ARR, and most of it recovers with better dunning automation.
Classifying churn this way changes where you spend money. If a third of your losses are involuntary, fixing payment retries and card update flows delivers faster ROI than a full onboarding redesign.
What’s a Good B2B SaaS Churn Rate by Segment?
The 3.5% median annual logo churn figure is a starting point, not a target you can copy blind. Benchmarks from Recurly and similar industry sources show wide variation once you segment by average revenue per account (ARPA) and contract length, and treating one number as universal is how teams set targets that don’t match their business.

Lower-ARPA, self-serve products tend to run higher churn, often in the high single digits or low double digits annually, because switching costs are low and buyers are less committed.
A practical way to set your own target:
Segment your customer base by ARPA tier (say, under $5,000/year, $5,000 to $50,000, and above $50,000).
Calculate churn separately for each tier rather than blending them into one company-wide number.
Weight your target toward whichever tier drives the most ARR, since that’s where revenue churn hits hardest.
Factor in contract length: month-to-month customers should be benchmarked against month-to-month peers, not against your annual-contract enterprise base.
A word of caution on the benchmark data itself: most published churn benchmarks come from surveys with self-selected respondents, and companies that report favorable numbers tend to respond more often. Sample sizes for enterprise-tier segments are often small. And a persistent error worth watching for: comparing your customer churn against someone else’s published revenue churn, or vice versa. The two metrics measure different things, and mixing them makes your business look better or worse than it actually is.
Why Does Churn Rate Matter for Revenue Growth?
Churn is a compounding tax on everything else you do well. It directly shrinks customer lifetime value (LTV), which stretches your CAC payback period. This means the same sales and marketing spend generates less long-term revenue, even if your acquisition numbers look identical to last year.
Here’s a compact illustration. Say your average customer generates $2,000 in monthly revenue and your customer acquisition cost is $6,000.
This is why finance teams often care more about revenue churn than logo churn. Losing ten small accounts worth $500 a month each stings less than losing one $50,000-a-year account, even though logo churn treats both events identically. Tracking revenue churn and Net Revenue Retention together gives a truer read on where growth is actually leaking.
A drop from 5% to 3% monthly churn can nearly double customer lifetime value.
Revenue churn exposes concentration risk that logo churn hides entirely.
CAC payback periods lengthen automatically as churn rises, even with flat acquisition costs.
How Can You Reduce B2B Churn Rate?
Fixing churn without diagnosing it first is how retention budgets get wasted. The most effective playbooks start by separating voluntary from involuntary churn, then segmenting by ARPA tier before choosing which lever to pull, since a play that works for enterprise accounts often flops with self-serve customers and vice versa.
Diagnose before you spend. Pull the last two quarters of churned accounts and tag each one by root cause: champion loss, payment failure, competitor switch, budget cut, or poor fit. Whichever category carries the most lost MRR gets the first fix.
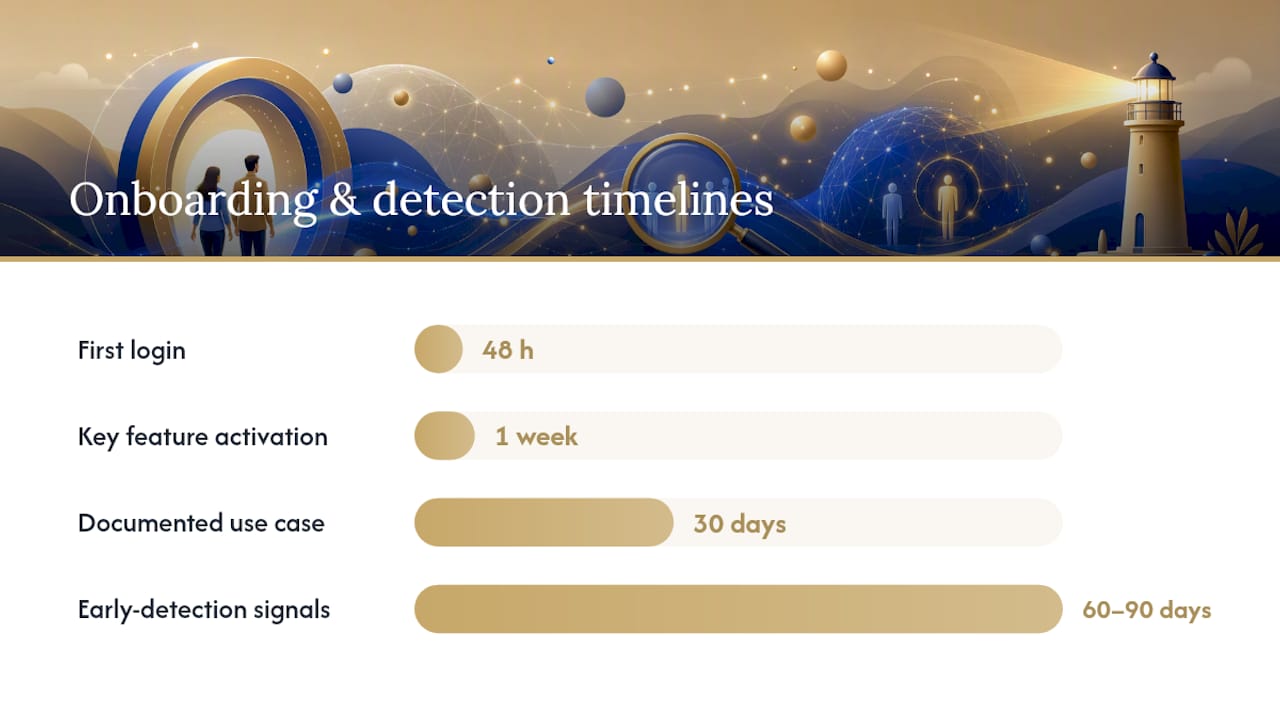
Fix onboarding checkpoints. Structured onboarding measurably reduces early-stage churn. Track specific milestones: first login within 48 hours, key feature activation within week one, and a documented use case by day 30. Accounts that miss these checkpoints churn at far higher rates.
Build early-detection signals. Declining product usage, dropping NPS scores, and rising support ticket volume are leading indicators of voluntary churn, often visible 60 to 90 days before cancellation. Route flagged accounts to customer success for a save conversation, not an automated email.
Automate involuntary-churn recovery. Card update prompts, smart dunning sequences with retry timing, and expiration alerts recover a meaningful share of failed-payment losses with minimal manual effort.
Run enterprise-specific plays. Multi-thread every account so the relationship doesn’t live with one champion, align an executive sponsor on your side with one on theirs, and build renewal timelines around procurement cycles, not just the contract end date.
Segmentation matters here more than most teams admit: a self-serve SMB customer needs automated nudges and in-app guidance, while a high-touch enterprise account needs a human relationship and a business review. Applying enterprise tactics to SMB accounts burns budget; applying SMB automation to enterprise accounts feels impersonal at the worst possible moment.
Pro Tip: Run each new retention tactic as a controlled experiment on one segment for a full quarter before rolling it out company-wide. Churn moves slowly, and a change that looks like it’s working after four weeks often reverts once the initial novelty wears off.
How Should You Report and Monitor Churn?
Cohort analysis is the backbone of accurate churn reporting. Group customers by signup month, then track what percentage of each cohort remains active at 30, 60, 90, and 365 days. This reveals whether churn concentrates in the first quarter (an onboarding problem) or spreads evenly across the customer lifecycle (a product-fit or competitive problem), something a single blended churn number can’t show you.
A functional churn dashboard should track:
Customer churn rate and revenue churn rate, reported separately, never blended into one figure.
Net Revenue Retention (NRR), which nets out churn against expansion revenue from upsells.
Churn broken out by cohort and by ARPA tier, so a bad month for enterprise accounts doesn’t get masked by a good month for SMB.
Involuntary churn as its own line item, since it’s the most fixable category.
Two mistakes show up constantly in churn reporting. The first is multiplying a monthly rate by 12 to get an annual figure instead of compounding it, which understates the real number every time. The second is mixing customer churn and revenue churn in the same chart without labeling which is which, which makes trend lines meaningless to anyone reading the deck cold.
For cadence, review churn weekly at the team level so early-detection signals get acted on fast, and review it monthly at the leadership level alongside NRR and CAC payback. Set an alert threshold, such as a cohort’s 90-day retention dropping more than five points below the prior cohort, so problems surface before quarter-end reporting.
What Does Flockleads See Across B2B Lead Generation Clients?
Churn often starts before a customer ever signs a contract. If the lead that closed was a poor fit for the product, no amount of onboarding polish saves the account. Flockleads works with B2B companies on the acquisition side of this problem, and the pattern shows up repeatedly: tightening lead qualification criteria and improving the handoff from marketing to onboarding measurably cuts early-stage churn, because the customers arriving in month one actually match the product’s ideal use case.
The accounts most likely to churn in the first 90 days are rarely the ones with a bad onboarding experience. They’re the ones who never should have been sold the product in the first place.
A few practices worth sharing with your product and customer success teams:
Track churn by lead source, not just by ARPA tier, to spot which acquisition channels bring in customers who stick.
Flag activation rate by lead source as an early warning metric, since low activation almost always predicts churn 60 to 90 days later.
Treat the sales-to-onboarding handoff as a measurable step, with a documented use case captured at close, not assumed later.
Where Should Leaders Focus First on Churn?
If I had to pick three decisions for a leadership team to make this quarter, they’d be these. First, fix involuntary churn recovery before anything else. It’s mechanical, it’s measurable within 30 days, and it recovers revenue you’re currently losing for no strategic reason at all. Second, put someone in charge of the 60 to 90 day usage-drop signal and give them authority to intervene, not just report on it. Third, if your highest-ARPA tier churns at the same rate as your lowest, that’s not a coincidence. It means nobody is treating enterprise accounts differently, and that gap alone often explains more lost revenue than any product problem.
On build versus buy: if your team can dedicate a full-time owner to lead qualification and onboarding handoff within 90 days, build internally. If that owner doesn’t exist and won’t for two more quarters, a managed partner closes the gap faster than a slow internal hire.
— Mieke
A Managed Path to Better-Fit Leads and Lower Early Churn
Fixing churn after a bad-fit lead has already signed a contract is the expensive way to solve the problem. Flockleads runs targeted acquisition campaigns across Meta, LinkedIn, Google, and TikTok specifically for B2B companies, with qualifying forms built to filter out poor-fit prospects before they ever reach your sales team.

That upfront filtering matters more than most retention playbooks admit: a lead that matches your ideal customer profile from the start needs less hand-holding in onboarding and sticks around longer, no matter how good your customer success team is. Flockleads pairs qualified lead delivery with CRM integration and weekly campaign optimization, so the leads landing in your pipeline are already closer to the profile that renews. If your team is spread thin between acquisition and retention work, a managed setup like this frees up customer success to focus on the accounts already in-house rather than triaging poor-fit signups. Start with a free lead generation audit to see where your current lead quality stands against your churn numbers.
Sources
Frequently asked questions
What Is Churn Rate in Simple Words?
Churn rate is the percentage of customers or revenue you lose over a given period, calculated as customers lost divided by customers you started with, multiplied by 100.
How Do I Calculate My Churn Rate?
Divide the number of customers (or the amount of MRR) lost during a period by the number you started with, then multiply by 100; to convert a monthly rate to annual, use the compound formula rather than multiplying by 12.
NEED A CLEARER PLAN?
Let’s turn your next move into momentum.
Talk to us →